pyINSPECTA demo
[1]:
from __future__ import annotations

import matplotlib as mpl
import matplotlib.pyplot as plt

mpl.rcParams["figure.dpi"] = 150

from sdhdf import SDHDF
from sdhdf.logger import logger

logger.setLevel("INFO")
Matplotlib is building the font cache; this may take a moment.
Let’s load an SDHDF file - it is represented by an SDHDF class instance:
[2]:
# SDHDF v1.9.3 (NOTE: This file has a single integration only)
### Required to load local data for example - not needed for normal use
from importlib import resources

with resources.as_file(resources.files("sdhdf.data.tests")) as test_data:
    fname = "sdhdf_v1.9.3.hdf"
    file_path = test_data / fname
[3]:
sdhdf = SDHDF(file_path, parallel=True)
sdhdf - INFO: Dask dashboard at: http://127.0.0.1:8787/status
sdhdf - INFO: SDHDF version: 2.0
sdhdf - WARNING: Path '/beam_0/metadata/cal_band_params' not found in file
sdhdf - WARNING: Path '/beam_0/band_SB0/astronomy_data/data_weights' not found in file
sdhdf - WARNING: Path '/beam_0/band_SB0/astronomy_data/data_flags' not found in file
sdhdf - WARNING: Path '/beam_0/band_SB0/calibrator_data/cal32_data' not found in file
sdhdf - WARNING: Path '/beam_0/band_SB0/calibrator_data/cal_data_on' not found in file
sdhdf - WARNING: Path '/beam_0/band_SB0/calibrator_data/cal_data_off' not found in file
sdhdf - WARNING: Path '/beam_0/band_SB0/calibrator_data/cal_data_weights' not found in file
sdhdf - WARNING: Path '/beam_0/band_SB0/calibrator_data/cal_data_flags' not found in file
sdhdf - WARNING: Path '/beam_0/band_SB0/calibrator_data/cal_frequency' not found in file
sdhdf - WARNING: Path '/beam_0/band_SB0/metadata/cal_obs_params' not found in file
sdhdf - WARNING: Path '/config/cal_backend_config' not found in file
sdhdf - WARNING: No flags found for sub-band 'band_SB0' in file '/home/docs/checkouts/readthedocs.org/user_builds/pyinspecta/checkouts/latest/.venv/lib/python3.12/site-packages/sdhdf/data/tests/sdhdf_v1.9.3.hdf'!
sdhdf - WARNING: Band 'band_SB0' flags will be set to all zeros.
sdhdf - WARNING: No frequency dimension labels found in file! Attempting to match dimensions to data shape...
The SDHDF class instance contains information on the beams…
[4]:
sdhdf.beams[0]
[4]:
Beam(label='beam_0', filename=PosixPath('/home/docs/checkouts/readthedocs.org/user_builds/pyinspecta/checkouts/latest/.venv/lib/python3.12/site-packages/sdhdf/data/tests/sdhdf_v1.9.3.hdf'), definition={'version': '2.0', 'beam': {'attributes': {'DESCRIPTION': 'SDHDF group containing data products specific to the antenna beam', 'NAME': 'beam', 'SDHDF_CLASS': 'sdhdf_beam'}, 'metadata': {'attributes': {'DESCRIPTION': 'SDHDF group containing observation metadata', 'NAME': 'metadata', 'SDHDF_CLASS': 'sdhdf_meta'}, 'band_params': 'metadata/band_params', 'cal_band_params': 'metadata/cal_band_params'}, 'band': {'attributes': {'DESCRIPTION': 'SDHDF group containing data products specific to the frequency band', 'NAME': 'band', 'SDHDF_CLASS': 'sdhdf_band'}, 'astronomy': {'data': 'astronomy_data/data', 'weights': 'astronomy_data/data_weights', 'flags': 'astronomy_data/data_flags', 'frequency': 'astronomy_data/frequency'}, 'calibrator': {'cal_binned': 'calibrator_data/cal32_data', 'cal_on': 'calibrator_data/cal_data_on', 'cal_off': 'calibrator_data/cal_data_off', 'weights': 'calibrator_data/cal_data_weights', 'flags': 'calibrator_data/cal_data_flags', 'frequency': 'calibrator_data/cal_frequency'}, 'metadata': {'attributes': {'DESCRIPTION': 'SDHDF group containing observation metadata', 'NAME': 'metadata', 'SDHDF_CLASS': 'sdhdf_meta'}, 'obs_params': 'metadata/obs_params', 'cal_obs_params': 'metadata/cal_obs_params'}}}, 'config': {'attributes': {'DESCRIPTION': 'SDHDF group containing configuration parameters as defined at the time of the observation', 'NAME': 'config', 'SDHDF_CLASS': 'sdhdf_config'}, 'backend': 'config/backend_config', 'cal_backend': 'config/cal_backend_config'}, 'metadata': {'attributes': {'DESCRIPTION': 'SDHDF group containing observation metadata', 'NAME': 'metadata', 'SDHDF_CLASS': 'sdhdf_meta'}, 'beam_params': 'metadata/beam_params', 'history': 'metadata/history', 'primary_header': 'metadata/primary_header', 'software': 'metadata/software_versions'}}, in_memory=False, client=<Client: 'tcp://127.0.0.1:43011' processes=2 threads=2, memory=6.54 GiB>)
…and all associated metadata:
[5]:
sdhdf.metadata
[5]:
MetaData(filename=PosixPath('/home/docs/checkouts/readthedocs.org/user_builds/pyinspecta/checkouts/latest/.venv/lib/python3.12/site-packages/sdhdf/data/tests/sdhdf_v1.9.3.hdf'))
Let’s explore the observation metadata - for example the primary_header dataset can be displayed with:
[6]:
sdhdf.metadata.primary_header
[6]:
| DATE | HDR_DEFN | HDR_DEFN_VERSION | FILE_FORMAT | FILE_FORMAT_VERSION | SCHED_BLOCK_ID | CAL_MODE | INSTRUMENT | OBSERVER | OBS_TYPE | PID | RECEIVER | TELESCOPE | UTC_START | N_BEAMS | |
|---|---|---|---|---|---|---|---|---|---|---|---|---|---|---|---|
| 0 | 2021-04-08-04:57:40 | SDHDF | 1.9.3 | HDF | 5.0 | 25494 | OFF | Medusa | kac014 | ScanContinuum | P1117 | UWL | Parkes | 2021-04-07-18:49:04 | 1 |
The attribute keys and descriptions can be accessed with:
[7]:
sdhdf.metadata.primary_header.attrs.keys()
[7]:
dict_keys(['CAL_MODE', 'DATE', 'DESCRIPTION', 'FILE_FORMAT', 'FILE_FORMAT_VERSION', 'HDR_DEFN', 'HDR_DEFN_VERSION', 'INSTRUMENT', 'NAME', 'N_BEAMS', 'OBSERVER', 'OBS_TYPE', 'PID', 'RECEIVER', 'SCHED_BLOCK_ID', 'SDHDF_CLASS', 'TELESCOPE', 'UTC_START'])
[8]:
sdhdf.metadata.primary_header.attrs.values()
[8]:
dict_values(['Calibration mode (ON | OFF)', 'File creation date (UTC YYYY-MM-DD-hh:mm:ss)', 'General observation metadata', 'File format', 'File format version', 'File format definition', 'File format definition version', 'Backend instrument name', 'primary_header', 'Number of beams', 'Observer name', 'Observation type (TRACK | SCAN)', 'Project ID', 'Receiver name', 'Schedule block ID', 'sdhdf_table', 'Telescope name', 'Observation start (UTC YYYY-MM-DD-hh:mm:ss)'])
The attribute values, for example for the key ‘TELESCOPE’, can be accessed from the table:
[9]:
sdhdf.metadata.primary_header.table["TELESCOPE"][0]
[9]:
'Parkes'
The same applies for accessing the observation parameters with for example:
[10]:
sdhdf.metadata.obs_params
[10]:
| ELAPSED_TIME | TIME_DB | MJD | UTC | UT_DATE | AEST | RA_STR | DEC_STR | RA_DEG | DEC_DEG | ... | RA_OFFSET | DEC_OFFSET | AZ_OFFSET | EL_OFFSET | AZ_DRIVE_RATE | ZE_DRIVE_RATE | HOUR_ANGLE | PARA_ANGLE | WIND_DIR | WIND_SPD | |
|---|---|---|---|---|---|---|---|---|---|---|---|---|---|---|---|---|---|---|---|---|---|
| 0 | 0.492 | 2021-04-07T18:49:04.49Z | 59311.78408 | 18:49:04.49 | 2021-04-07 | 04:49:05.39 | 19:30:21.47 | -63:42:45.01 | 292.5895 | -63.7125 | ... | 0.0 | 0.0 | 0.0 | 0.0 | 0.3949 | 0.1966 | 333.7163 | -40.7 | 4.0 | 124.0 |
1 rows × 25 columns
The Beam class contains the subband data - these can be accessed in a similar way to the beams:
[11]:
sdhdf.beams[0].subbands
[11]:
[SubBand(label='band_SB0', filename=PosixPath('/home/docs/checkouts/readthedocs.org/user_builds/pyinspecta/checkouts/latest/.venv/lib/python3.12/site-packages/sdhdf/data/tests/sdhdf_v1.9.3.hdf'), definition={'version': '2.0', 'beam': {'attributes': {'DESCRIPTION': 'SDHDF group containing data products specific to the antenna beam', 'NAME': 'beam', 'SDHDF_CLASS': 'sdhdf_beam'}, 'metadata': {'attributes': {'DESCRIPTION': 'SDHDF group containing observation metadata', 'NAME': 'metadata', 'SDHDF_CLASS': 'sdhdf_meta'}, 'band_params': 'metadata/band_params', 'cal_band_params': 'metadata/cal_band_params'}, 'band': {'attributes': {'DESCRIPTION': 'SDHDF group containing data products specific to the frequency band', 'NAME': 'band', 'SDHDF_CLASS': 'sdhdf_band'}, 'astronomy': {'data': 'astronomy_data/data', 'weights': 'astronomy_data/data_weights', 'flags': 'astronomy_data/data_flags', 'frequency': 'astronomy_data/frequency'}, 'calibrator': {'cal_binned': 'calibrator_data/cal32_data', 'cal_on': 'calibrator_data/cal_data_on', 'cal_off': 'calibrator_data/cal_data_off', 'weights': 'calibrator_data/cal_data_weights', 'flags': 'calibrator_data/cal_data_flags', 'frequency': 'calibrator_data/cal_frequency'}, 'metadata': {'attributes': {'DESCRIPTION': 'SDHDF group containing observation metadata', 'NAME': 'metadata', 'SDHDF_CLASS': 'sdhdf_meta'}, 'obs_params': 'metadata/obs_params', 'cal_obs_params': 'metadata/cal_obs_params'}}}, 'config': {'attributes': {'DESCRIPTION': 'SDHDF group containing configuration parameters as defined at the time of the observation', 'NAME': 'config', 'SDHDF_CLASS': 'sdhdf_config'}, 'backend': 'config/backend_config', 'cal_backend': 'config/cal_backend_config'}, 'metadata': {'attributes': {'DESCRIPTION': 'SDHDF group containing observation metadata', 'NAME': 'metadata', 'SDHDF_CLASS': 'sdhdf_meta'}, 'beam_params': 'metadata/beam_params', 'history': 'metadata/history', 'primary_header': 'metadata/primary_header', 'software': 'metadata/software_versions'}}, beam_label='beam_0', in_memory=False, client=<Client: 'tcp://127.0.0.1:43011' processes=2 threads=2, memory=6.54 GiB>)]
The data are stored as either an xarray.Dataset or pandas.DataFrame depending on the data type:
[12]:
sdhdf.beams[0].subbands[0].astronomy_dataset
[12]:
<xarray.Dataset> Size: 10kB
Dimensions:        (time: 1, frequency: 256, polarization: 4, bin: 1, meta: 25)
Coordinates: (12/28)
    ELAPSED_TIME   (time) float64 8B 0.492
    TIME_DB        (time) object 8B '2021-04-07T18:49:04.49Z'
    MJD            (time) float64 8B 5.931e+04
    UTC            (time) object 8B '18:49:04.49'
    UT_DATE        (time) object 8B '2021-04-07'
    AEST           (time) object 8B '04:49:05.39'
    ...             ...
    PARA_ANGLE     (time) float64 8B -40.7
    WIND_DIR       (time) float64 8B 4.0
    WIND_SPD       (time) float64 8B 124.0
  * frequency      (frequency) float32 1kB 719.6 719.6 719.6 ... 719.7 719.7
  * time           (time) int64 8B 0
  * meta           (meta) object 200B 'ELAPSED_TIME' 'TIME_DB' ... 'WIND_SPD'
Dimensions without coordinates: polarization, bin
Data variables:
    data           (time, polarization, frequency, bin) float32 4kB dask.array<chunksize=(1, 4, 256, 1), meta=np.ndarray>
    flag           (polarization, frequency) float32 4kB dask.array<chunksize=(4, 256), meta=np.ndarray>
metadata (time, meta) object 200B 0.49200000000000005 ... 124.0[13]:
sdhdf.metadata.frequency.table
[13]:
| 0 | 1 | 2 | 3 | 4 | 5 | 6 | |
|---|---|---|---|---|---|---|---|
| 0 | CLASS | DESCRIPTION | FRAME | NAME | REFERENCE_LIST | SDHDF_CLASS | UNIT |
| 1 | b'DIMENSION_SCALE' | SDHDF frequency data (default reference frame:... | topocentric | frequency | [[<HDF5 object reference>, 3]] | sdhdf_frequency | MHz |
For example, using the xarray.DataArray we have a lot of power to visualise and manipulate the data - see the xarray documentation for more information.
I’ve also implemented some commonly-used commands on methods inside the dataclasses. For example, we can make a waterfall plot, plot a spectrum, and inspect the metadata. This is all done with xarray or pandas under the hood - so much more complex investigations are possible using those tools.
Here’s a waterfall plot, which can be called from the SDHDF and Beam classes, but is really calling the base method on the Subband class:
[14]:
sdhdf.plot_waterfall(
    beam=0,
    subband=0,
    polarization=0,
    flag=False,
    norm=plt.cm.colors.LogNorm(vmin=1e0),
    y="ELAPSED_TIME",
)
sdhdf - WARNING: Cannot create a waterfall plot with a single integration!
Note that this is just a wrapper around the methods in xarray. You can use these directly for powerful visualisation and processing functionality, for example:
[15]:
if len(sdhdf.beams[0].subbands[0].astronomy_dataset.data["time"]) != 1:
    sdhdf.beams[0].subbands[0].astronomy_dataset.isel(polarization=0).data.plot(
        norm=plt.cm.colors.LogNorm(vmin=1e0, vmax=1e4), x="frequency", y="ELAPSED_TIME"
    )
else:
    logger.warning("Cannot create a waterfall plot with a single integration!")
sdhdf - WARNING: Cannot create a waterfall plot with a single integration!
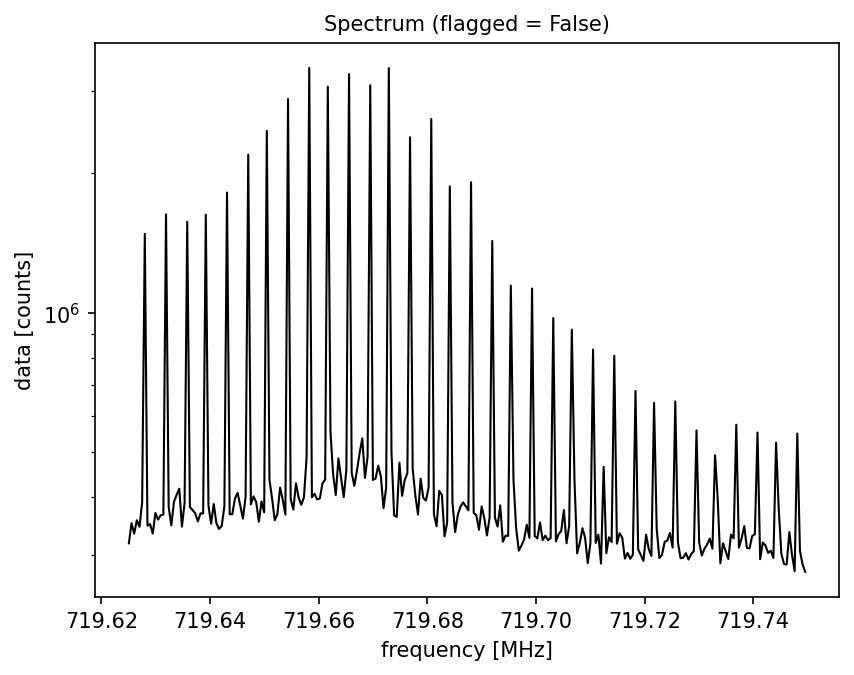
We can also plot the spectrum, for example:
[16]:
ax = sdhdf.plot_spectrum(
    beam=0, subband=0, x="frequency", flag=False, color="black", linewidth=1
)
ax.set_yscale("log")
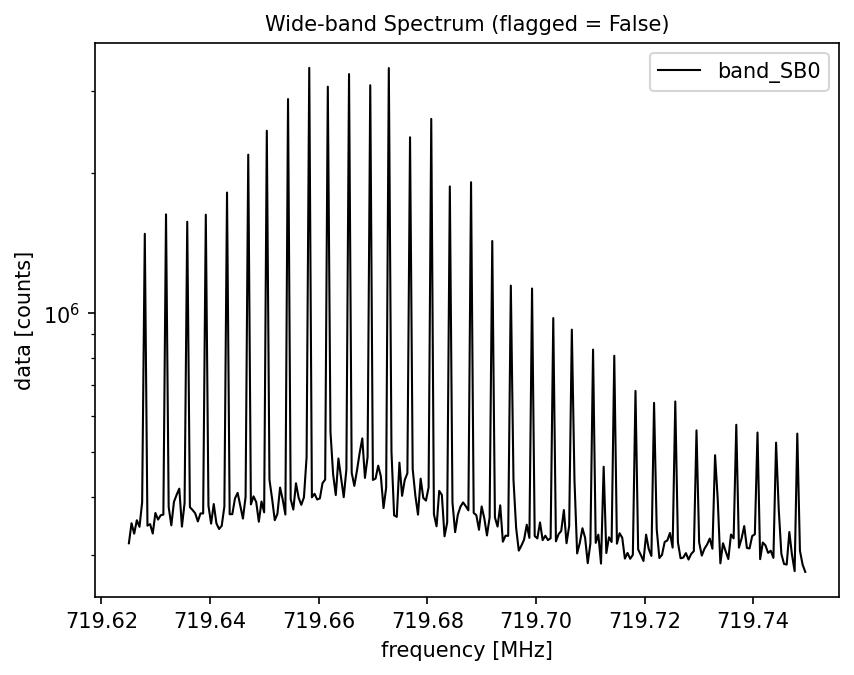
A wide-band plot can be called from the SDHDF object, but it also really just calling down to the Beam class:
[17]:
ax = sdhdf.plot_wide(
    beam=0, polarization=0, x="frequency", flag=False, color="black", linewidth=1
)
ax.set_yscale("log")
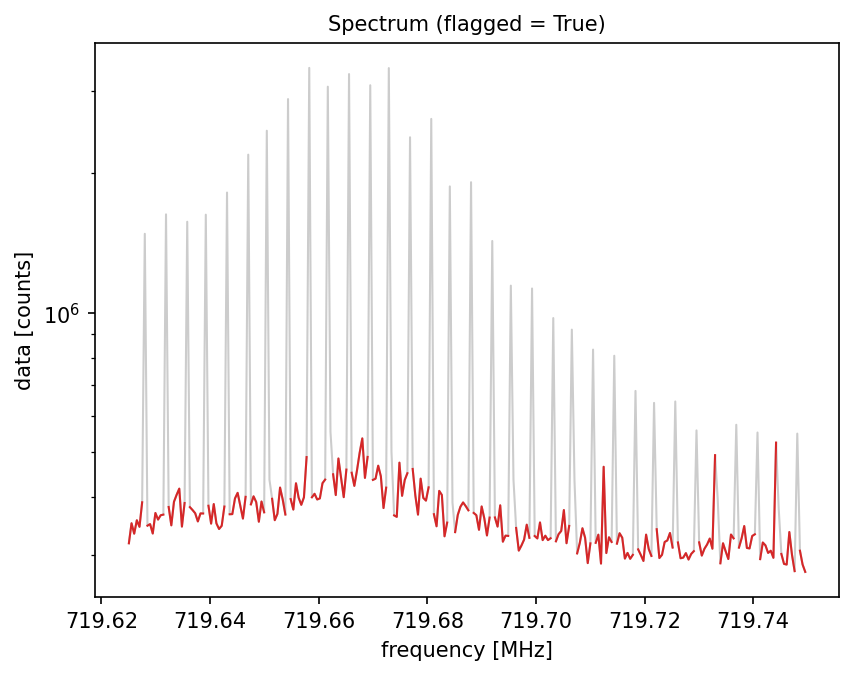
Now let’s try and apply the RFI flagging routine:
[18]:
sdhdf.auto_flag_rfi(sigma=5, n_windows=1, flag_persistent=False)
[19]:
fig, ax = plt.subplots()
_ = sdhdf.plot_spectrum(
    beam=0,
    subband=0,
    polarization=0,
    x="frequency",
    flag=False,
    color="black",
    linewidth=1,
    alpha=0.2,
    ax=ax,
)
ax.set_yscale("log")

_ = sdhdf.plot_spectrum(
    beam=0,
    subband=0,
    polarization=0,
    x="frequency",
    flag=True,
    color="tab:red",
    linewidth=1,
    ax=ax,
)
ax.set_yscale("log")